NetApp Data ONTAP 7 and 8 has the ability to sniff packets but the trace file cant be viewed on the controller. You can open and manipulate the trace file in Wireshark on another host. This HOWTO uses Wireshark on Windows 7. Wireshark on Linux will work as well. You must have Wireshark already installed on your Windows/Linux host before you start. You can download it here:
Windows: http://www.wireshark.org/download.html
Debian based Linux:
> apt-get install wireshark
RPM based Linux:
> yum install wireshark
1) Identify the controller’s NIC where you want to sniff packets on. In this case we will use e0a.
netapp> ifconfig -a
e0a: flags=0xe48867<UP,BROADCAST,RUNNING,MULTICAST> mtu 1500
inet 10.10.10.140 netmask 0xffffff00 broadcast 10.10.10.255
ether 00:0c:29:89:3f:3c (auto-1000t-fd-up) flowcontrol full
e0b: flags=0xe08866<BROADCAST,RUNNING,MULTICAST> mtu 1500
ether 00:0c:29:89:3f:46 (auto-1000t-fd-up) flowcontrol full
e0c: flags=0xe08866<BROADCAST,RUNNING,MULTICAST> mtu 1500
ether 00:0c:29:89:3f:50 (auto-1000t-fd-up) flowcontrol full
e0d: flags=0xe08866<BROADCAST,RUNNING,MULTICAST> mtu 1500
ether 00:0c:29:89:3f:5a (auto-1000t-fd-up) flowcontrol full
lo: flags=0x1b48049<UP,LOOPBACK,RUNNING,MULTICAST,TCPCKSUM> mtu 9188
inet 127.0.0.1 netmask 0xff000000 broadcast 127.0.0.1
losk: flags=0x40a400c9<UP,LOOPBACK,RUNNING> mtu 9188
inet 127.0.20.1 netmask 0xff000000 broadcast 127.0.20.1
2) Using the pktt command, start the capture on interface e0a and dump the output into /etc/log on the controller. When you run the command, a file is created in /etc/log/ with the NIC name (e0a), a date/time stamp and a .trc file extension.
netapp> pktt start e0a -d /etc/log
e0a: started packet trace
3) You can check the status of the packet capture and get details.
netapp> pktt status
e0a: Packet tracing enabled; packets truncated at 1514 bytes.
e0a: Trace buffer utilization = 2% of 1048320 bytes, 258 packets
e0a: 0 bytes written to file /etc/log/e0a_20131108_173928.trc
e0a: Currently tracing to file /etc/log/e0a_20131108_173928.trc
e0a: 258 packets seen; 0 packets dropped; 24936 total bytes seen
lo: Packet tracing enabled; packets truncated at 1514 bytes.
lo: Trace buffer utilization = 99% of 130816 bytes, 1011 packets
lo: 1387 packets seen; 0 packets dropped; 160568 total bytes seen
losk: Packet tracing enabled; packets truncated at 1514 bytes.
losk: Trace buffer utilization = 99% of 130816 bytes, 282 packets
losk: 40901 packets seen; 0 packets dropped; 21761277 total bytes seen
4) After a period of time you deem adequate, stop the packet capture.
netapp> pktt stop e0a
e0a: Tracing stopped and packet trace buffers released.
Fri Nov 8 17:42:25 EST [sim81:cmds.pktt.write.info:info]: pktt: 280 packets seen, 0 dropped, 32046 bytes written to /etc/log/e0a_20131108_173928.trc.
5) Verify that it has stopped.
netapp> pktt status
e0a: packet tracing not enabled
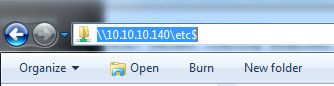
6) Open Windows Explorer on the PC/Server and enter the UNC path to the /etc/ folder on the filer. If you don’t have CIFS enabled and use NFS, mount the file system to your UNIX host. \\10.10.10.140\etc$
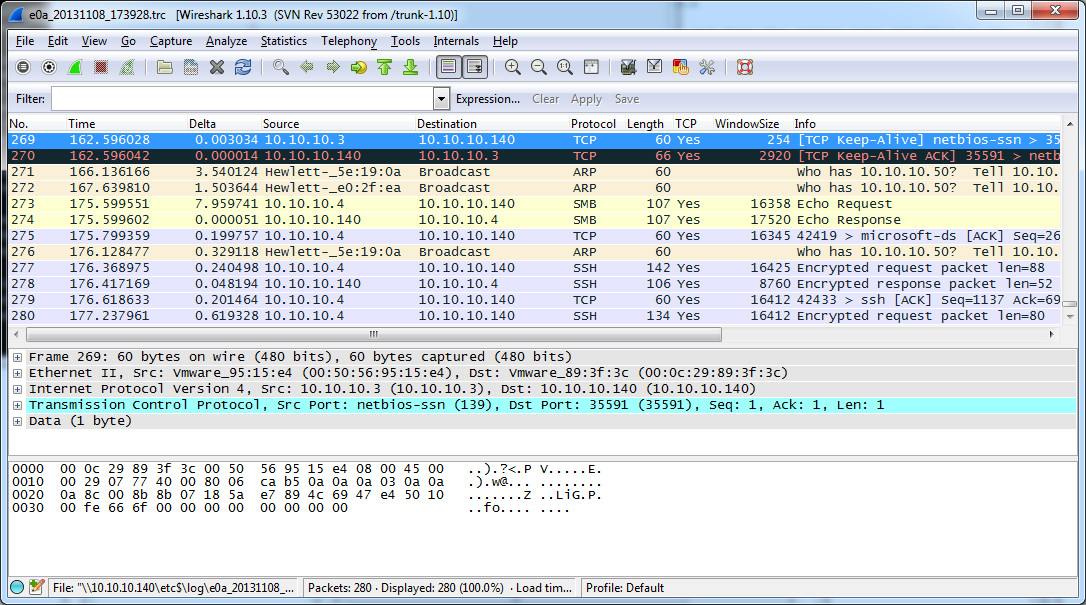
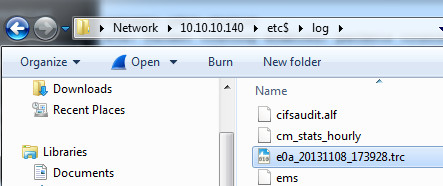
7) Browse to the log folder and locate the .trc file you just created. Double-click the file and it will load in Wireshark.
8) You can now operate on the trace file and filter, search and analyze packets.