• List of iSCSI Mutual CHAP Posts by OS
  • Tools and Utilities for Windows
  • Unix and Linux Distros

slice2

slice2

Tag Archives: Wireshark

Using Wireshark and Splunk to find iSCSI CHAP Negotiation Failures on VMware ESXi

02 Monday Dec 2013

Posted by Slice2 in iSCSI, NetApp, Security, VMware, Wireshark

≈ Leave a comment

Tags

iSCSI, NetApp, Security, VMware, Wireshark

This is a companion post to sniffing packets in ESXi I posted here.

Say you need to isolate traffic to troubleshoot iSCSI CHAP session negotiation failures between ESXi and NetApp storage.

Using Wireshark:

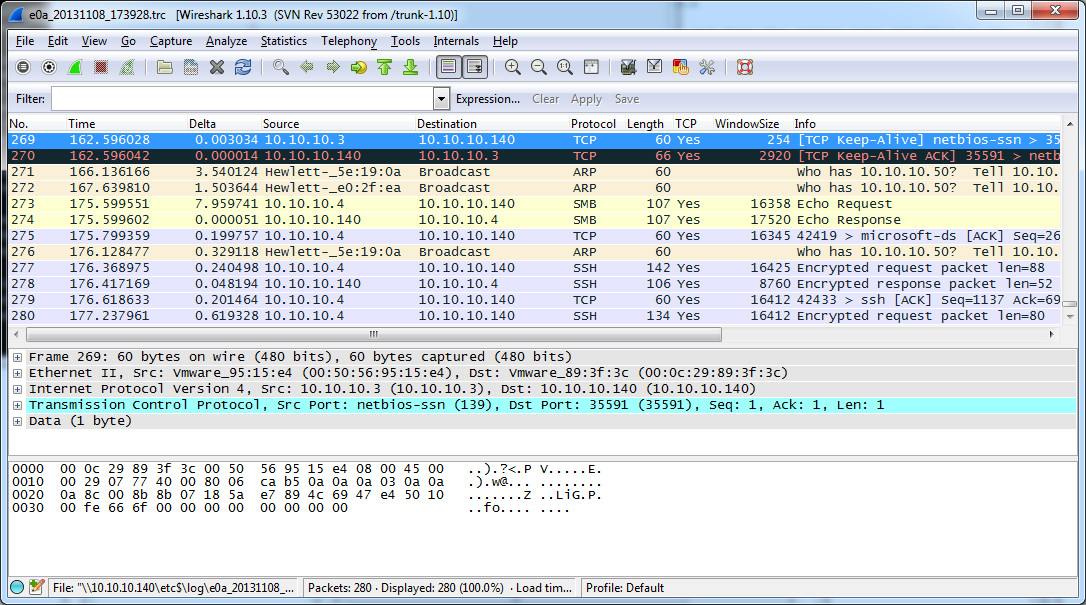
1) Dump the traffic to a pcap file and open it with Wireshark.  Before you start the capture, change directories so you can easily recover the pcap file from the datastore in vCenter.

> cd /vmfs/volumes/datastore1
> tcpdump-uw -i vmk1 -s 1514 -w esxihost01.pcap
> CTRL+C
a) When done, in vCenter select the ESXi host you were sniffing packets on, then click the Configuration tab > Storage.
b) Right-click datastore1 (or the datastore were your pcap file is) and select Browse datastore.
c) Click download a file > select the location and click OK.
d) Double-click the file and it will open in Wireshark.
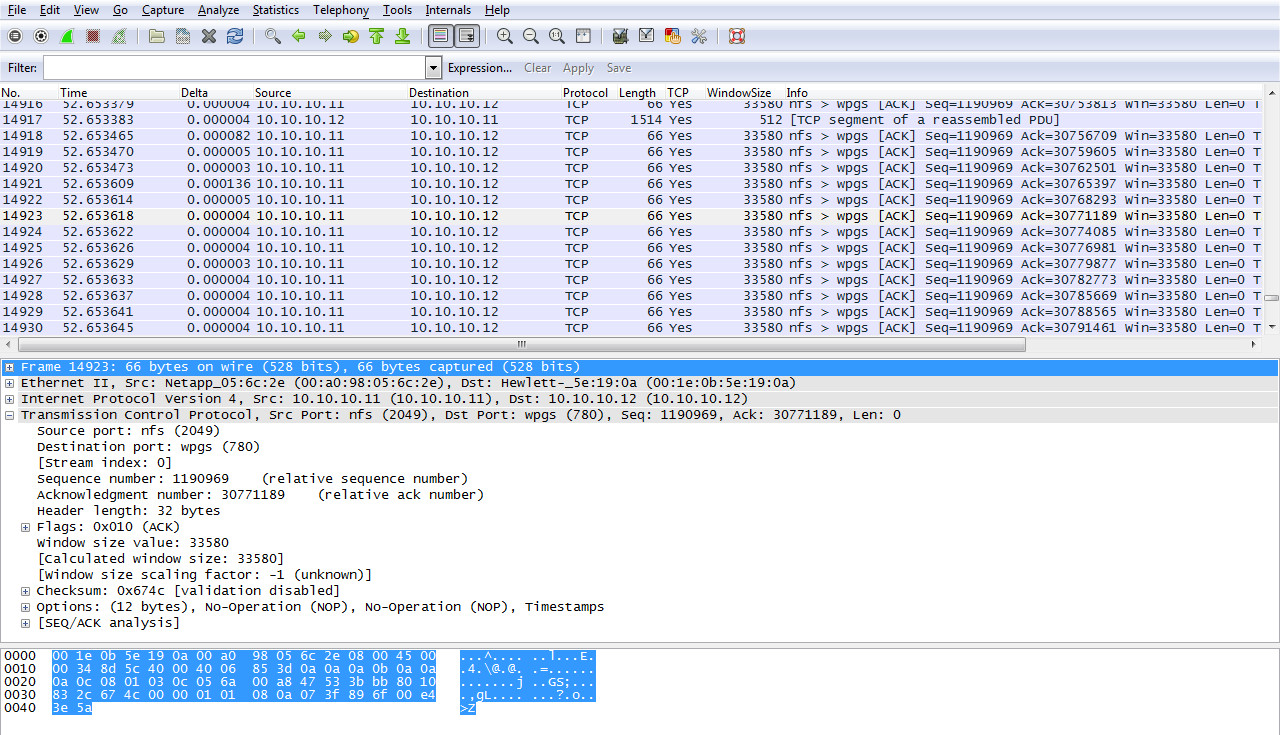
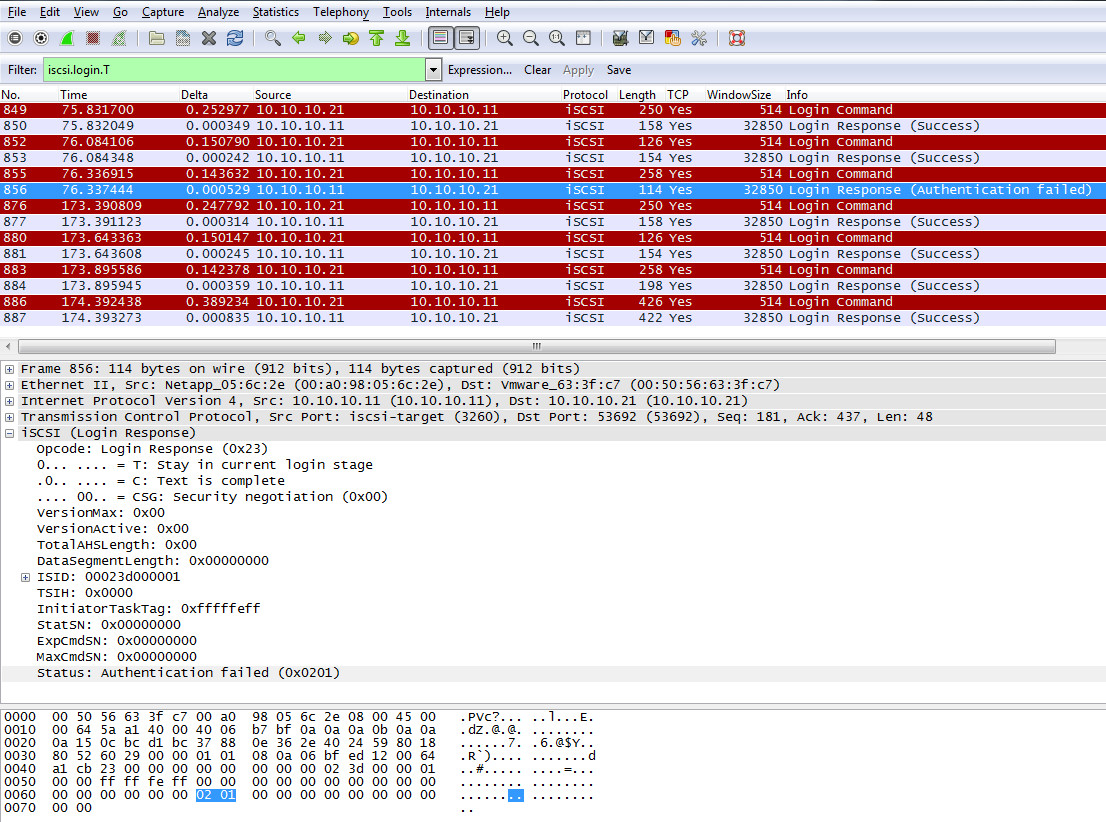
e) In Wireshark, in the upper left, enter iscsi.login.T in the Filter: field and click Apply. This only shows the iSCSI login packets. You can clearly see on the right in the Info column, packet 856 is an Authentication Failure packet.

wiresharkISCSIlogin

Using Splunk:

Another way to see the authentication failure is with Splunk. Assuming your NetApp storage (or any vendor) is configured to send syslog to Splunk, you can easily find the event. Splunk is an excellent Syslog server. You can download and use it for free up to 500 Megs a day indexed. I won’t go into the Splunk configuration in this post. I’ll post that soon.

Download it from here: http://www.splunk.com/download?r=header

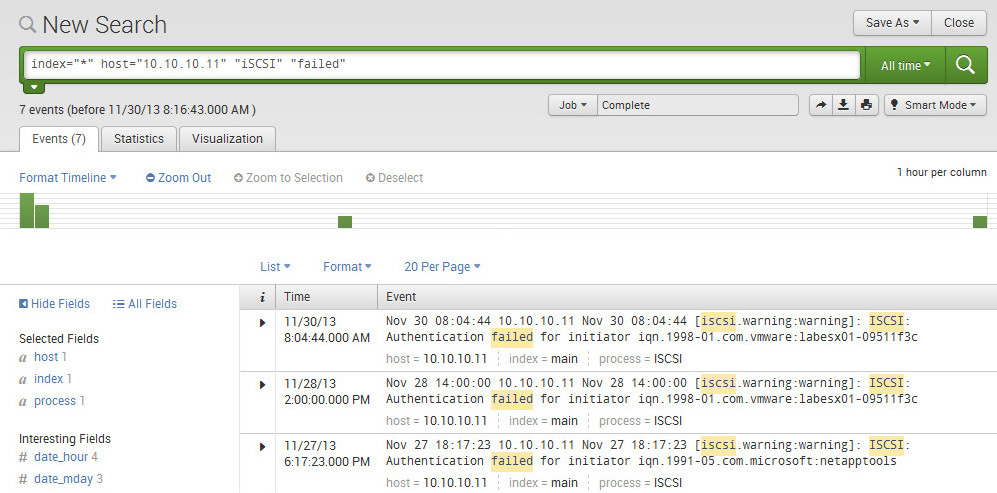
1) Login to the Splunk UI, click Search to launch the Search app, enter the string below and the results will be displayed.

> index=”*” host=”10.10.10.11″ “iSCSI” “failed”

– Note: replace the IP address with your storage controller hostname or IP.

SplunkiSCSIlogin

Sniffing Packets on VMware ESXi 5.1 and Viewing the Capture in Wireshark

01 Sunday Dec 2013

Posted by Slice2 in VMware, Wireshark

≈ Leave a comment

Tags

VMware, Wireshark

So you need to sniff packets on ESXi 5x for troubleshooting purposes and you are not sure how to get it done. Hopefully this post will assist you. You can access the ESXI CLI from the console or via Putty/xterm by enabling SSH on the host. I prefer SSH access because the buffers in Putty/xterm make life easier.

You can use Wireshark to read the pcap files. Download and install for your OS in this way:
Windows: http://www.wireshark.org/download.html

Debian based Linux:
> apt-get install wireshark

RPM based Linux:
> yum install wireshark

1) Enable SSH on the host.
a) In vCenter, select the Host > Configuration tab > Security Profile > in the Security Profile section click Properties.
b) Scroll down to SSH and select it, then click Options > Start > OK > OK.
c) Launch an xterm or PuTTY session to the ESXi host and login as root.

2) Determine what VMKernel Ports you have on the host.
> esxcfg-vmknic -l | grep vmk
vmk0  Management Network  IPv4 10.10.10.13 255.255.255.0  10.10.10.255  00:1b:78:e0:2f:ea 1500 65535 true STATIC
vmk1  vMotion and iSCSI   IPv4 10.10.10.22 255.255.255.0  10.10.10.255  00:50:56:6f:ba:f2 1500 65535 true STATIC

2) In this case we have two.  Your production systems should have more.
vmk0 – ESXi management network. The default VMKernel Port created when you install ESXi.
vmk1 – vMotion and iSCSI. This is one I created for my LAB used for vMotion and iSCSI traffic.

3) At its most basic, specify the vmk port number and you see the packets fly by.
> tcpdump-uw -i vmk0
a) to stop, simply press CTRL+C.

Three things you need to know about tcpdump-uw:
a) tcpdump-uw only captures the first 68 bytes of data from a packet. To capture the full packet, use the -s option with a value of 1514 for normal MTU or 9014 for jumbo frames.
b) Also, tcpdump-uw can capture a max of 8138 bytes because of buffer constraints. The -B 9 option increases the buffer allowing the capture of up to 9014 bytes.
c) Captures on the vmkernel interface (vmk) only captures network traffic traversing to and from the vmkernel on that interface. It doesnt capture traffic moving across the Virtual Switch.
d) There are quite a few option for so play around with them.
> tcpdump-uw -?
tcpdump-uw version 4.0.0vmw
libpcap version 1.0.0
Usage: tcpdump-uw [-aAdDefIKlLnNOpqRStuUvxX] [ -B size ] [ -c count ]
[ -C file_size ] [ -E algo:secret ] [ -F file ] [ -G seconds ]
[ -i interface ] [ -M secret ] [ -r file ]
[ -s snaplen ] [ -T type ] [ -w file ] [ -W filecount ]
[ -y datalinktype ] [ -z command ] [ -Z user ]
[ expression ]

For example, for default MTU:
> tcpdump-uw -i vmk0 -s 1514
For Jumbo Frames:
> tcpdump-uw -i vmk0 -s 9014 -B 9

4) A few examples to get you started.
a) Dump packets on vmk0 with default MTU very verbose output showing only DNS packets (port 54).
> tcpdump-uw -i vmk0 -s 1514 -vvv port 53

b) Same as above except show NTP packets.
> tcpdump-uw -i vmk0 -s 1514 -vvv port 123

c) Is vCenter communicating properly with the ESXi host?  
> tcpdump-uw -i vmk0 -s 1514 -vvv port 902

d) Filter by transport type – TCP or UDP.
> tcpdump-uw -i vmk0 -s 1514 udp
> tcpdump-uw -i vmk0 -s 1514 tcp

e) Filter for ARP packets.
> tcpdump-uw -i vmk0 -s 1514 udp | grep ARP

5) You can dump the traffic to a pcap file and open it with Wireshark. Before you start the capture, change directories so you can easily recover the pcap file from the datastore in vCenter.

> cd /vmfs/volumes/datastore1
> tcpdump-uw -i vmk0 -s 1514 -w esxihost01.pcap
> When ready to stop capturing packets, press CTRL+C
a) When done, in vCenter select the ESXi host you were sniffing packets on, then click the Configuration tab > Storage.
b) Right-click datastore1 (or the datastore were your pcap file is) and select Browse datastore.
c) Right-click the esxihost01.pcap file > select Download, select a location and click OK.
d) Double-click the file and it will open in Wireshark.esxipacketsniff

HOWTO use Wireshark to read a packet capture from NetApp Data ONTAP after running the pktt command.

08 Friday Nov 2013

Posted by Slice2 in NetApp, Wireshark

≈ Leave a comment

Tags

NetApp, Wireshark

NetApp Data ONTAP 7 and 8 has the ability to sniff packets but the trace file cant be viewed on the controller. You can open and manipulate the trace file in Wireshark on another host. This HOWTO uses Wireshark on Windows 7. Wireshark on Linux will work as well. You must have Wireshark already installed on your Windows/Linux host before you start. You can download it here:

Windows: http://www.wireshark.org/download.html

Debian based Linux:
> apt-get install wireshark

RPM based Linux:
> yum install wireshark

1) Identify the controller’s NIC where you want to sniff packets on. In this case we will use e0a.
netapp> ifconfig -a

e0a: flags=0xe48867<UP,BROADCAST,RUNNING,MULTICAST> mtu 1500
inet 10.10.10.140 netmask 0xffffff00 broadcast 10.10.10.255
ether 00:0c:29:89:3f:3c (auto-1000t-fd-up) flowcontrol full
e0b: flags=0xe08866<BROADCAST,RUNNING,MULTICAST> mtu 1500
ether 00:0c:29:89:3f:46 (auto-1000t-fd-up) flowcontrol full
e0c: flags=0xe08866<BROADCAST,RUNNING,MULTICAST> mtu 1500
ether 00:0c:29:89:3f:50 (auto-1000t-fd-up) flowcontrol full
e0d: flags=0xe08866<BROADCAST,RUNNING,MULTICAST> mtu 1500
ether 00:0c:29:89:3f:5a (auto-1000t-fd-up) flowcontrol full
lo: flags=0x1b48049<UP,LOOPBACK,RUNNING,MULTICAST,TCPCKSUM> mtu 9188
inet 127.0.0.1 netmask 0xff000000 broadcast 127.0.0.1
losk: flags=0x40a400c9<UP,LOOPBACK,RUNNING> mtu 9188
inet 127.0.20.1 netmask 0xff000000 broadcast 127.0.20.1

2) Using the pktt command, start the capture on interface e0a and dump the output into /etc/log on the controller. When you run the command, a file is created in /etc/log/ with the NIC name (e0a), a date/time stamp and a .trc file extension.
netapp> pktt start e0a -d /etc/log
e0a: started packet trace

3) You can check the status of the packet capture and get details.
netapp> pktt status
e0a: Packet tracing enabled; packets truncated at 1514 bytes.
e0a: Trace buffer utilization = 2% of 1048320 bytes, 258 packets
e0a: 0 bytes written to file /etc/log/e0a_20131108_173928.trc
e0a: Currently tracing to file /etc/log/e0a_20131108_173928.trc
e0a: 258 packets seen; 0 packets dropped; 24936 total bytes seen

lo: Packet tracing enabled; packets truncated at 1514 bytes.
lo: Trace buffer utilization = 99% of 130816 bytes, 1011 packets
lo: 1387 packets seen; 0 packets dropped; 160568 total bytes seen

losk: Packet tracing enabled; packets truncated at 1514 bytes.
losk: Trace buffer utilization = 99% of 130816 bytes, 282 packets
losk: 40901 packets seen; 0 packets dropped; 21761277 total bytes seen

4) After a period of time you deem adequate, stop the packet capture.
netapp> pktt stop e0a
e0a: Tracing stopped and packet trace buffers released.
Fri Nov  8 17:42:25 EST [sim81:cmds.pktt.write.info:info]: pktt: 280 packets seen, 0 dropped, 32046 bytes written to /etc/log/e0a_20131108_173928.trc.

5) Verify that it has stopped.
netapp> pktt status
e0a: packet tracing not enabled

6) Open Windows Explorer on the PC/Server and enter the UNC path to the /etc/ folder on the filer. If you don’t have CIFS enabled and use NFS, mount the file system to your UNIX host.   \\10.10.10.140\etc$

pktt01

7) Browse to the log folder and locate the .trc file you just created. Double-click the file and it will load in Wireshark.

pktt02

8) You can now operate on the trace file and filter, search and analyze packets.

pktt03

HOWTO find a NetBSD iSCSI Initiator Name (iqn) with Wireshark

19 Thursday Sep 2013

Posted by Slice2 in NetBSD, Wireshark

≈ Leave a comment

Tags

NetBSD, Wireshark

The BSD variants make it difficult to quickly determine your iSCSI initiator name or iqn but I’m told they are working on a solution. While sniffing packets is an effective method of discovery, it’s simply far to cumbersome in a busy IT shop. If you know of an easier way to display the initiator please add a comment below and I’ll post it. This post is a followup to my previous list of ways to display initiators on various platforms. I have not tested this with the other BSD variants but assume the packets would be the same.

1) Install Wireshark on the NetBSD server.

> pkg_add wireshark

2) Make sure iscsi is started on the NetBSD server.

> iscsid

3) Add your storage array (your target that will present the lun)

> iscsictl add_send_target -a 10.10.10.11

Added Send Target 1

4) Refresh your target list.

> iscsictl refresh_targets

OK

5) List your targets.

> iscsictl list_targets

1: iqn.1992-08.com.netapp:sn.84167939

2: 10.10.10.11:3260,1000

6) Launch Wireshark. 

> wireshark

6a) In the Wireshark GUI, click Capture > Start to initiate packet sniffing.

8) Login to the target. In this case we’ll use target 2.

> iscsictl login -P 2

Created Session 2, Connection 1

9) List your iscsi session with your target (storage array).

> iscsictl list_sessions

Session 2: Target iqn.1992-08.com.netapp:sn.84167939

10) Stop the packet sniffing.

a) Click on Capture > Stop.

Note: click image to enlarge. The next two steps are depicted in this image.

iscsiwireshark

b) In the upper left, in the Filter: field enter “iscsi.isid” without the quotes and on the right click Apply.

11) Select the first packet from your server. In the middle expand iSCSI (Login Command), and then expand Key/Value Pairs. The first entry should list the InitiatorName= value. That is your iSCSI initiator or host iqn. In this case it’s iqn.1994-04.org.netbsd:iscsi.nbsd611.lab.slice2.com.

Follow Blog via Email

Enter your email address to follow this blog and receive notifications of new posts by email.

Recent Posts

  • Patch Alma Linux 8.7 on an Offline or Air-Gapped System
  • HOWTO Remove /home logical volume and add that space to the root partition
  • Patch Rocky Linux 8.6 on an Offline or Air-Gapped System
  • HOWTO Install the Splunk Universal Forwarder on FreeBSD
  • HOWTO install a Splunk Universal Forwarder on Solaris 11 SPARC and x64 Using pkg(p5p) and tar
  • HOWTO install a Splunk Universal Forwarder on Solaris 10 SPARC and x64 Using pkgadd and tar
  • Recover Files from a Windows NTFS partition using Linux based SystemRescue
  • Sysmon Event ID 1 Process Creation rules for Splunk Universal Forwarder and McAfee All Access
  • Upgrading CentOS 7.2003 to 7.2009 on an Offline or Air-Gapped System
  • HOWTO Easily Resize the Default LVM Volume on Ubuntu 18.04
  • Create a Docker Container for your Cisco ESA, SMA or WSA Offline Content Updates
  • Apply the Mozilla Firefox STIG to Firefox on Ubuntu Linux 18.04
  • Dynamically Resize Those Tiny BlackArch Linux Terminals and Add a Scrollbar
  • Kali Linux OVA for Air-Gapped Use Build Process
  • HOWTO install the XFCE 4 Desktop on NetBSD 8.1
  • Build a Kali Linux ISO with the latest OS patches and packages
  • HOWTO quickly STIG Firefox 59.01
  • HOWTO mount a Synology NAS SMB share on Linux with SMBv1 disabled
  • Howto safely delete the WSUS WID on Windows 2012R2
  • HOWTO quickly STIG Firefox 45.0.1
  • Completing the vSphere vCenter Appliance Hardening Process
  • HOWTO install the XFCE 4.12 Desktop on NetBSD 7
  • Enabling TLS 1.2 on the Splunk 6.2x Console and Forwarders using Openssl and self signed certs.
  • HOWTO enable SSH on a Cisco ASA running 9.1.x
  • Apply a Windows 2012 R2 Domain GPO to a standalone Windows 2012 R2 server
  • Enable legacy SSL and Java SSL support in your browser for those old, crusty websites
  • HOWTO update FreeBSD 10.1 to the latest 11-current release
  • HOWTO Secure iSCSI Luns Between FreeBSD 10.1 and NetApp Storage with Mutual CHAP
  • HOWTO install the XFCE 4 Desktop on NetBSD 6.1.5
  • HOWTO Secure iSCSI Luns Between Ubuntu Server 14.10 and NetApp Storage with Mutual CHAP

Categories

  • Cisco (2)
  • ESXi (4)
  • FreeBSD (2)
  • HP (5)
  • iSCSI (12)
  • Linux (31)
  • Nessus (3)
  • NetApp (31)
  • NetBSD (10)
  • Oracle (9)
  • Security (48)
  • Solaris (9)
  • Splunk (5)
  • VMware (19)
  • Windows (20)
  • Wireshark (4)
  • XFCE (3)

Archives

  • February 2023
  • August 2022
  • July 2022
  • April 2022
  • March 2022
  • February 2022
  • January 2022
  • November 2021
  • January 2021
  • December 2020
  • November 2020
  • August 2020
  • May 2020
  • September 2019
  • August 2019
  • March 2018
  • November 2016
  • March 2016
  • January 2016
  • November 2015
  • July 2015
  • June 2015
  • February 2015
  • January 2015
  • December 2014
  • November 2014
  • October 2014
  • September 2014
  • August 2014
  • July 2014
  • May 2014
  • April 2014
  • March 2014
  • February 2014
  • January 2014
  • December 2013
  • November 2013
  • October 2013
  • September 2013
  • August 2013
  • July 2013
  • June 2013
  • May 2013
  • April 2013
  • March 2013

Blogroll

  • Adobe Security Bulletins
  • CentOS Blog
  • Cisco Security Blog
  • CSO Magazine
  • DHS National Vulnerability Database
  • Eric Sloof's NTPRO
  • HT SSL Tests
  • Intel Corp Security Advisories
  • Internet Usage World Stats
  • Kali Linux Blog
  • Linux Mint Blog
  • Meltdown and Spectre
  • Microsoft Security Blog
  • Microsoft Security Intelligence Report
  • Microsoft Security Research & Defense
  • Microsoft Security Response Center
  • MITRE CVE Site
  • NetApp Blogs
  • NetBSD Blog
  • Oracle OTN Security
  • Oracle Security Blog
  • PacketStorm
  • Redhat Security Blog
  • SC Magazine
  • Shodan Search Engine
  • US-CERT Alerts
  • US-CERT Bulletins
  • US-CERT Vulnerability Notes KB
  • VMware Blogs
  • VMware Security Advisories

Category Cloud

Cisco ESXi FreeBSD HP iSCSI Linux Nessus NetApp NetBSD Oracle Security Solaris Splunk VMware Windows Wireshark XFCE

Follow Blog via Email

Enter your email address to follow this blog and receive notifications of new posts by email.

Join 38 other subscribers

Powered by WordPress.com.


Loading Comments...